Your H-1B Sponsor's Denial Rate Is Public
Before you accept an offer you can check how often that employer's H-1B petitions are refused. USCIS publishes it. Among the nineteen largest sponsors the rate runs from 0.49% to 3.62% — and the year you look at matters more than almost anyone realises.
In this guide (5 sections)
Most people choose an H-1B sponsor on salary, team and reputation. Almost nobody checks the one number that decides whether the visa happens at all: how often that employer's petitions are refused.
USCIS publishes it, employer by employer, in the H-1B Employer Data Hub. We aggregated the fiscal year 2022 file — the most recent complete year available for download — covering 51,664 employers and 465,777 decisions.
The national picture
| Petition type | Approved | Denied | Denial rate |
|---|---|---|---|
| Initial (your first petition with that employer) | 138,381 | 3,132 | 2.21% |
| Continuing (extension or amendment) | 327,810 | 6,454 | 1.93% |
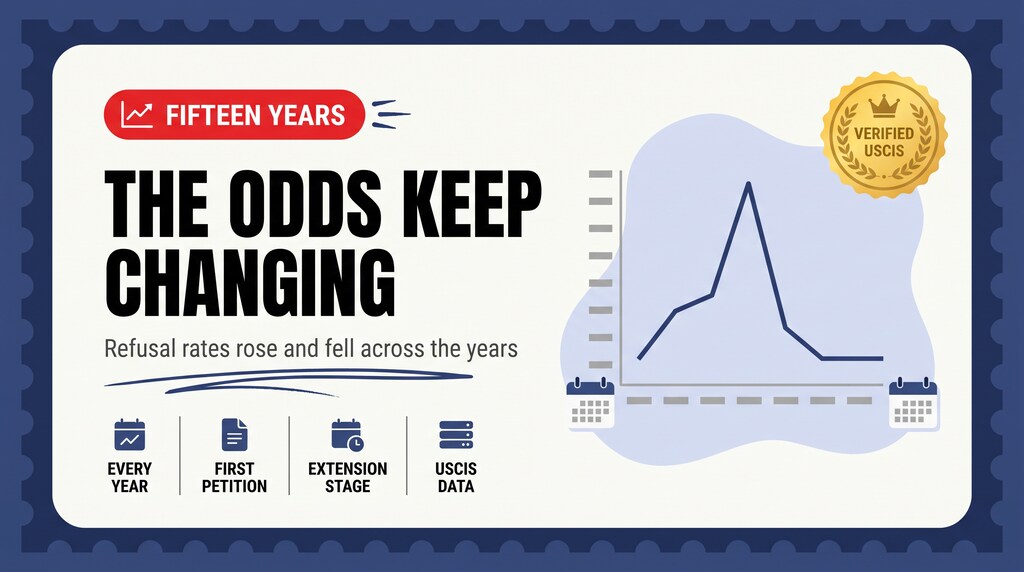
Those are historically low numbers, and that is the first thing to understand: a denial rate is a snapshot of a policy era, not a fixed property of an employer. See how these rates moved between 2009 and 2023 before you read too much into any single year.
The largest sponsors, ranked by initial denial rate
Nineteen employers had 500 or more initial decisions in FY2022.
| Employer | Initial decisions | Initial denial rate | Continuing denial rate |
|---|---|---|---|
| HCL America | 1,214 | 3.62% | 2.49% |
| Tech Mahindra Americas | 512 | 3.52% | 2.34% |
| Tata Consultancy Services | 2,810 | 3.06% | 3.39% |
| Amazon Com Services | 1,109 | 2.25% | 1.27% |
| Wipro | 1,178 | 2.21% | 3.12% |
| Infosys | 3,178 | 1.57% | 0.55% |
| IBM | 1,257 | 1.51% | 1.13% |
| Capgemini America | 1,106 | 1.45% | 1.12% |
| Amazon Web Services | 703 | 1.14% | 1.57% |
| Deloitte Consulting | 715 | 1.12% | 0.64% |
| Intel | 870 | 1.03% | 2.83% |
| Amazon.com Services | 4,078 | 1.03% | 1.84% |
| Apple | 939 | 0.96% | 1.06% |
| Cognizant | 2,532 | 0.91% | 1.04% |
| 1,573 | 0.70% | 1.12% | |
| Meta Platforms | 1,391 | 0.58% | 0.76% |
| Ernst & Young US | 701 | 0.57% | 0.86% |
| Accenture | 1,101 | 0.54% | 1.13% |
| Microsoft | 1,013 | 0.49% | 1.10% |
The full range is 0.49% to 3.62% — a sevenfold spread, but in a year when even the worst of them refused fewer than one in twenty-five. The product companies cluster at the bottom and the IT services firms at the top, though Cognizant at 0.91% and Accenture at 0.54% sit below Amazon.
Initial and continuing rates do not track each other
Read both columns, because they often disagree. Intel refused 1.03% of initial petitions but 2.83% of extensions. Infosys runs 1.57% initial against 0.55% continuing. Wipro is 2.21% initial and 3.12% continuing.
So "which sponsor is safe" depends on whether you are filing your first petition or extending one. An employer that gets you in smoothly is not automatically the employer that keeps you in.
How to use this before you sign
- Look your prospective employer up by name in the USCIS Employer Data Hub. It is public and needs no account.
- Read the initial column if you are joining, the continuing column if you are extending.
- Check the volume before the percentage. One denial out of six is 17% and means nothing. Below roughly 50 decisions the rate is noise.
- Check which year you are looking at. The same employers were refused at five to ten times these rates in FY2018.
- Treat a high rate as a question, not a verdict. Ask how many of their petitions drew a request for evidence last year.
If you are also comparing pay, our salary data by role and city and the wage floors hiding in Dallas offers cover the money side.
What this data cannot tell you
A denial rate is not a measure of employer quality. It reflects the mix of roles filed, how specialised they are, whether staff sit at third-party worksites, and how the employer handles requests for evidence. A firm placing people at client sites faces a harder evidentiary test than a university hiring a researcher.
FY2022 is the most recent complete year USCIS publishes as a downloadable file. A FY2023 file exists but contains roughly a quarter of FY2022's volume and appears to be a partial-year export, so we do not use it for rates or rankings. Later years are available only through the interactive hub.
The file records one row per employer per location, and we aggregated by employer name, so a company filing under several legal entities appears more than once. Small denominators swing percentages hard, which is why the table above is limited to employers with 500 or more initial decisions.
Questions
What is the average H-1B denial rate?
Which large H-1B sponsors have the highest denial rates?
Does a high denial rate mean the employer is bad?
Is the safest sponsor for a new H-1B also safest for an extension?
Where can I look up a specific employer?
Sources: USCIS — H-1B Employer Data Hub · USCIS — Understanding Our H-1B Employer Data Hub · USCIS — H-1B Employer Data Hub annual files (archive) · USCIS — H-1B Specialty Occupations