One in Four, Then One in Fifty
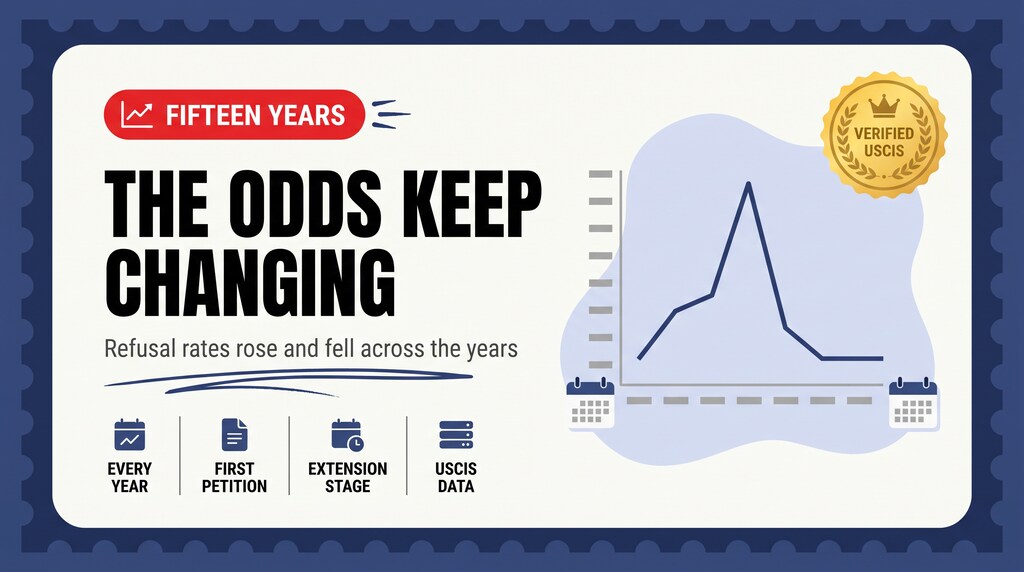
In 2018 almost one in four first-time H-1B petitions was refused. Four years later it was one in forty-five. Nothing about the applicants changed that much — which tells you how little a denial rate says about you, and how much it says about the year.
In this guide (5 sections)
People talk about H-1B odds as though they are a fixed property of the visa. They are not. We pulled every annual file USCIS publishes — fiscal years 2009 to 2023 — and totalled the approvals and denials.
The rate moved by a factor of eleven inside seven years.
The complete series
| Fiscal year | Initial approvals | Initial denials | Initial denial rate | Continuing denial rate |
|---|---|---|---|---|
| 2009 | 99,790 | 18,099 | 15.35% | 5.87% |
| 2010 | 84,038 | 7,352 | 8.04% | 4.53% |
| 2011 | 114,863 | 8,583 | 6.95% | 2.85% |
| 2012 | 140,809 | 7,401 | 4.99% | 3.03% |
| 2013 | 130,736 | 9,596 | 6.84% | 2.69% |
| 2014 | 130,616 | 10,645 | 7.54% | 2.94% |
| 2015 | 111,846 | 7,644 | 6.40% | 2.98% |
| 2016 | 105,092 | 11,295 | 9.70% | 4.45% |
| 2017 | 96,166 | 14,518 | 13.12% | 5.24% |
| 2018 | 87,889 | 28,181 | 24.28% | 11.83% |
| 2019 | 132,967 | 35,633 | 21.13% | 11.67% |
| 2020 | 122,894 | 18,276 | 12.95% | 6.65% |
| 2021 | 141,194 | 5,667 | 3.86% | 2.28% |
| 2022 | 138,381 | 3,132 | 2.21% | 1.93% |
From 6.40% in FY2015 to 24.28% in FY2018 to 2.21% in FY2022. The same visa, the same statute, the same kind of applicant.
The part that hurt most
Look at the last column rather than the headline one.
A continuing petition is an extension for someone already in the United States, already approved at least once, usually in the same job at the same employer. Those are people with apartments, car loans, school places and spouses on H-4. A one-in-eight refusal rate on that population is a different kind of event from a hard year for new applicants.
In FY2018 and FY2019 together, 67,045 continuing petitions were refused. That is the number behind a great many abrupt departures from the US.
What actually changed
Not the applicants. Initial approvals in FY2018 were 87,889 against 111,846 in FY2015 — fewer people getting through, from a pool that had not shrunk. The adjudication standard moved, and then moved back.
This is why a single year's denial rate is a weak signal about an employer and a weaker one about you. The firms that look risky in one file look safe in another. Our employer-level table uses FY2022 — a historically permissive year — and the same employers carried five to ten times those rates four years earlier.
How to read this if you are deciding now
- Treat current rates as a floor, not a forecast. FY2022's 2.21% is the lowest in fifteen years of published data. The series says conditions tighten as well as loosen.
- Weight the continuing column when you plan. Your first petition is one event; your extensions are many, and they are the ones that catch you mid-life.
- Prefer employers who file well in bad years, not good ones. Anyone looks clean at 2%. Ask how their petitions fared in FY2018 and FY2019 — a firm that kept its people through that period is telling you something a current table cannot.
- Keep the structural options open. Cap-exempt employers and the green card track both reduce how many times you have to roll this dice.
What this data cannot tell you
These totals are the sum of the per-employer rows USCIS publishes, so they count petitions decided in each fiscal year rather than people, and an individual may appear more than once across years.
FY2023 is excluded from the table. Its file contains 38,315 initial approvals against FY2022's 138,381 — roughly a quarter of the volume — and appears to be a partial-year export rather than a full year, so its rate is not comparable with the rest of the series.
The file does not say why anything was refused. Requests for evidence, specialty-occupation findings, worksite arrangements and employer-employee relationship questions all end in the same denial column. Attributing the swing to any single policy is beyond what this data supports — what it shows is the size and timing of the swing.
Questions
What is the highest H-1B denial rate ever recorded?
What is the current H-1B denial rate?
Were H-1B extensions also harder to get?
Does a low denial rate today mean H-1B is safe?
Why is fiscal year 2023 not in the table?
Sources: USCIS — H-1B Employer Data Hub · USCIS — H-1B Employer Data Hub annual files (archive, FY2009–FY2023) · USCIS — Understanding Our H-1B Employer Data Hub · USCIS — H-1B Specialty Occupations