The Bad Years Were Not Bad for Everyone
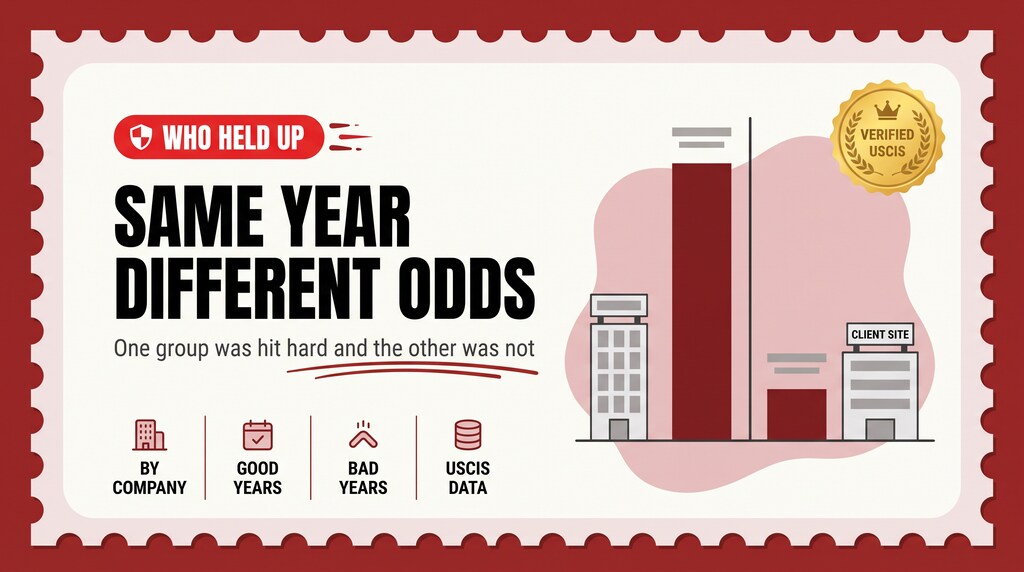
When H-1B denial rates peaked in 2018, the pain was not spread evenly. At one group of employers four in five petitions were refused. At another, fewer than one in fifty. The dividing line was not company size or prestige.
In this guide (5 sections)
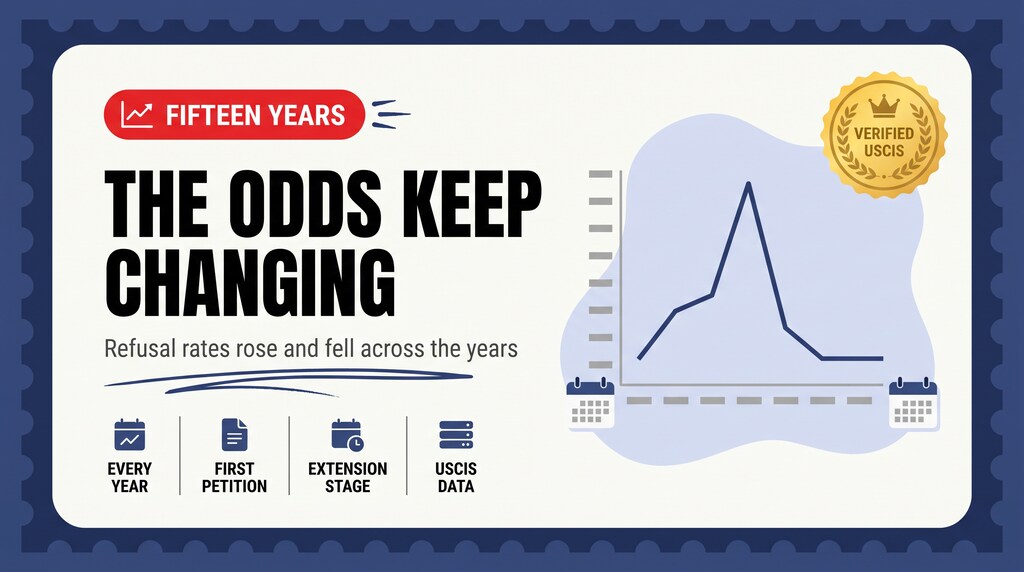
We showed in the fifteen-year series that H-1B initial denial rates ran from 6.40% in FY2015 to 24.28% in FY2018 and back down to 2.21% in FY2022.
That national average hides the thing that actually matters. We split the same USCIS files by employer.
The same year, two different visas
Initial denial rate, by company, across the squeeze and either side of it. Every row is a company with at least 200 initial decisions in FY2018.
| Company | FY2018 decisions | FY2015 | FY2018 | FY2019 | FY2022 |
|---|---|---|---|---|---|
| Capgemini | 1,343 | 4.5% | 79.6% | 45.2% | 1.4% |
| Cognizant | 1,309 | 7.7% | 61.2% | 56.4% | 0.9% |
| Infosys | 431 | 2.5% | 48.3% | 35.5% | 1.8% |
| HCL America | 299 | 1.7% | 34.4% | 32.9% | 3.6% |
| Accenture | 528 | 4.4% | 30.7% | 42.4% | 0.5% |
| Wipro | 395 | 7.1% | 28.1% | 47.2% | 2.2% |
| Deloitte | 1,523 | 18.2% | 26.4% | 37.0% | 0.9% |
| Tech Mahindra | 794 | 3.9% | 25.6% | 37.1% | 3.4% |
| Tata Consultancy Services | 689 | 5.6% | 22.6% | 30.5% | 3.1% |
| — and in the same years — | |||||
| Amazon | 2,919 | 1.1% | 1.9% | 4.0% | 1.2% |
| Apple | 714 | 1.5% | 1.8% | 2.4% | 1.0% |
| Microsoft | 1,269 | 1.2% | 1.0% | 6.0% | 0.5% |
| Intel | 884 | 0.5% | 1.0% | 3.1% | 1.0% |
| 676 | 0.0% | 1.0% | 2.5% | 0.0% | |
| 740 | — | 0.8% | 3.7% | 0.7% | |
Extensions told the same story
The continuing-petition column is where a tightening reaches people who already have an apartment and a school run. In FY2018:
| Company | Continuing denial rate, FY2018 |
|---|---|
| Cognizant | 28.8% |
| Capgemini | 25.6% |
| Infosys | 25.0% |
| Deloitte | 24.0% |
| HCL America | 19.5% |
| Tata Consultancy Services | 17.4% |
| Accenture / Tech Mahindra | 14.4% |
| Intel | 1.5% |
| Apple | 1.1% |
| 0.9% | |
| 0.8% |
More than a quarter of Cognizant's extension requests were refused that year. For someone three years into a US life, that is the number that ends it.
What the dividing line actually is
It is not size: Amazon filed more than any firm in the table and stayed at 1.9%. It is not prestige: Deloitte and Accenture are not small or obscure. It is not nationality either — Capgemini is French, Accenture Irish, Deloitte Anglo-American, and they sit alongside the Indian IT majors.
The line falls between companies that employ you to work on their own product, at their own site, and companies that place you at a client's site to deliver a service. The second model requires proving an employer-employee relationship and a specialty occupation at a location the petitioner does not control, and that is the test that tightened.
Note the one row that straddles it. IBM ran at 1.0% in FY2018 and 25.8% in FY2019 — a company with both a product business and a large services arm, landing on both sides within two years.
What this means if you are choosing now
- Current denial rates cannot distinguish these employers. By FY2022 every row above sits between 0.5% and 3.6%. The table that would have warned you in 2017 looks identical to the one that would not.
- Ask about the worksite, not the rate. Will you sit at the employer's own office on their own product, or at a client site? That single question separates the two halves of this table.
- If you take a client-site role, know what you are accepting. It is a completely legitimate route and hundreds of thousands of people have built careers on it. It is also the first thing to be squeezed when standards tighten — twice now, on this data.
- Weigh the extension risk, not just the entry risk. Entry is one filing. Extensions keep coming, and the FY2018 continuing column is what they look like in a bad year.
See also current employer denial rates, the cap-exempt route and the green card track, which reduces how often you have to file at all.
What this data cannot tell you
We aggregated every row whose employer name contains the company name, so these are company-wide figures across all filing entities rather than one legal entity. USCIS records one row per employer per location and spells the same company several ways, which is why aggregation is necessary and why small differences appear between methods.
The file records no reason for any denial. The worksite explanation above is the pattern the data is consistent with — a split that falls almost exactly along the service-delivery model — but USCIS publishes no reason codes, and we are not going to attribute the swing to a specific policy document we cannot point at.
FY2015 figures for Google are absent because the company did not appear under that name in that file. FY2023 is excluded throughout: its file holds about a quarter of FY2022's volume and appears to be a partial-year export.
Questions
Which H-1B employers had the highest denial rates in 2018?
Why were consultancy H-1B petitions denied so much more often?
Does a low denial rate today mean an employer is safe?
Were H-1B extensions affected too?
Was IBM affected?
Sources: USCIS — H-1B Employer Data Hub · USCIS — H-1B Employer Data Hub annual files (archive, FY2009–FY2023) · USCIS — Understanding Our H-1B Employer Data Hub · USCIS — H-1B Specialty Occupations