Half of All H-1Bs Go to One Industry
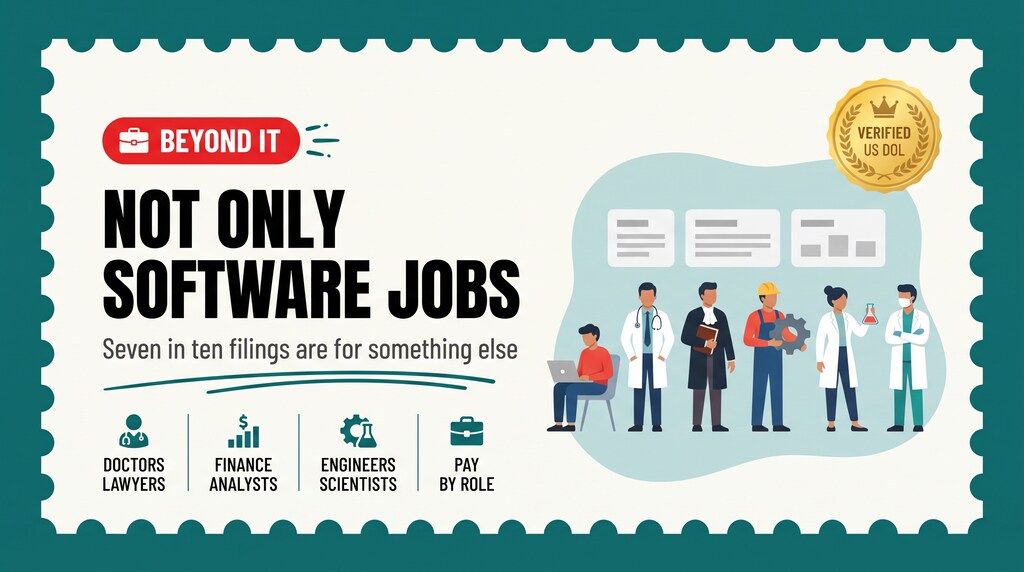
One industry takes more than half of all H-1B sponsorship, and it is also the one with the highest refusal rate among the big categories. The second-largest is one almost nobody applies to.
In this guide (4 sections)
We aggregated the USCIS H-1B Employer Data Hub for fiscal year 2022 — the most recent complete year published for download — and grouped 138,381 initial approvals by the employer's industry code.
Sponsorship by industry
| Industry | Initial approvals | Share | Initial denial rate |
|---|---|---|---|
| Professional, Scientific & Technical Services | 71,034 | 51.3% | 2.67% |
| Educational Services | 15,559 | 11.2% | 1.41% |
| Manufacturing | 11,756 | 8.5% | 1.71% |
| Information | 8,992 | 6.5% | 1.31% |
| Health Care & Social Assistance | 8,426 | 6.1% | 1.52% |
| Retail | 7,450 | 5.4% | 1.69% |
| Finance & Insurance | 7,178 | 5.2% | 1.50% |
| Admin & Support Services | 1,597 | 1.2% | 2.38% |
The first category is where IT consulting and engineering services sit — the firms most Indian graduates apply to. The second is universities and colleges. Add health care at 6.1%, and roughly 17% of all H-1B sponsorship happens in education and healthcare, at well under half the refusal rate of the crowded route.
That is the same pattern we found in the cap-exempt route: the less crowded path is also the safer one. It pays less. It is nowhere near as competitive.
Where the employers are
| State | Initial approvals | Share | Denial rate |
|---|---|---|---|
| California | 25,012 | 18.1% | 2.02% |
| Texas | 17,821 | 12.9% | 2.30% |
| New Jersey | 11,963 | 8.6% | 3.03% |
| New York | 10,700 | 7.7% | 1.93% |
| Virginia | 8,455 | 6.1% | 1.58% |
| Illinois | 7,334 | 5.3% | 1.58% |
| Massachusetts | 5,757 | 4.2% | 2.21% |
| Maryland | 4,734 | 3.4% | 2.49% |
California leads, as you would expect. The surprise is third place: New Jersey, a state of nine million people, sponsors more than New York and nearly as much as Texas. That is the IT services corridor around Edison and Iselin showing up in federal data — and it carries the highest denial rate of the big states at 3.03%.
What to do with this
- If you are in the 51.3%, assume competition and the highest base refusal rate of the major categories. That is not a reason to avoid it — it is where most jobs are — but check your specific employer in the denial-rate data rather than assume.
- If you are struggling, widen to education and healthcare before anything else. They are 17% of sponsorship and refuse at well under half the rate.
- Check the year. These are FY2022 figures from a historically permissive period. The same industries looked very different in FY2018.
What this data cannot tell you
Industry here is the employer's own classification code, not your job. A software engineer at a hospital is counted under health care, and a researcher employed by a consultancy under professional services. The table describes who files, not what work is done.
FY2022 is the latest complete downloadable year. A FY2023 file exists but holds roughly a quarter of FY2022's volume and appears to be a partial-year export, so shares computed from it are not comparable — we do not use it here.
Denial rates reflect the mix of roles and worksite arrangements in each industry, not employer quality. Industries that place staff at third-party client sites face a harder evidentiary test, and that alone moves the number.
Questions
Which industry sponsors the most H-1B workers?
Which industries have the lowest H-1B denial rates?
Does California sponsor the most H-1B workers?
Why does New Jersey rank so high?
Should I target education or healthcare employers instead?
Sources: USCIS — H-1B Employer Data Hub · USCIS — Understanding Our H-1B Employer Data Hub · USCIS — H-1B Employer Data Hub annual files (archive) · US Census Bureau — North American Industry Classification System (NAICS)