H-1B Salaries: What 391,748 Certified Filings Actually Pay
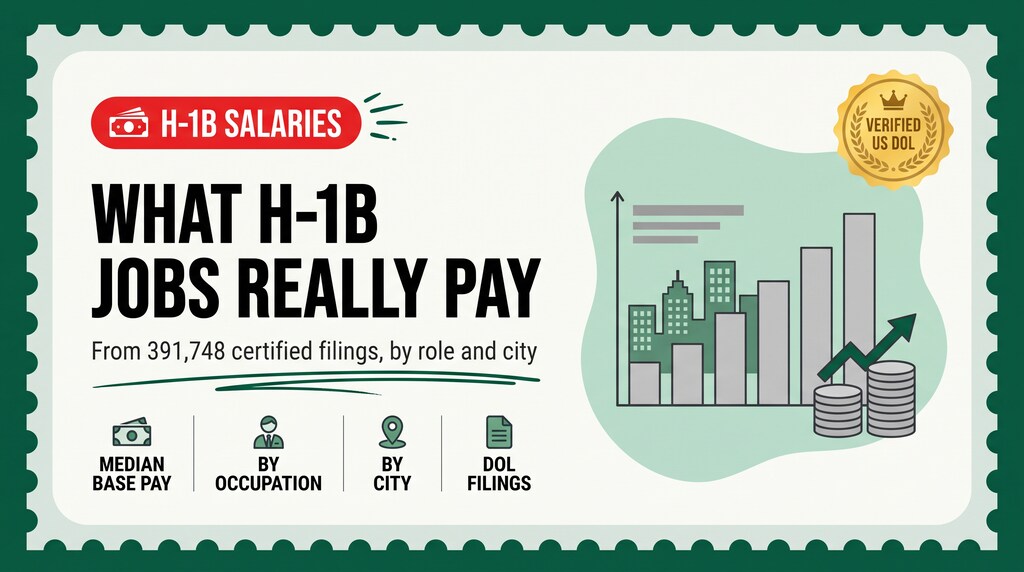
Salary sites report what people say they earn. This is what employers told the federal government they would pay, on a legal filing — 391,748 of them, broken down by occupation and city.
In this guide (4 sections)
Salary sites tell you what people say they earn. This article tells you what employers told the federal government they would pay — on a legal filing, under penalty of perjury, for a specific job title at a specific worksite.
Every H-1B petition requires a certified labor condition application, and the Department of Labor publishes all of them. We parsed the current quarterly file: 391,748 certified H-1B filings with a usable annual wage.
What each occupation pays
| Occupation (SOC) | Median | 25th pct | 75th pct | 90th pct | Filings |
|---|---|---|---|---|---|
| Software Developers | $144,936 | $115,894 | $177,861 | $212,202 | 118,662 |
| Data Scientists | $129,709 | $99,216 | $165,600 | $197,756 | 18,263 |
| Information Technology Project Managers | $138,800 | $111,113 | $168,876 | $201,164 | 13,317 |
| Computer Systems Engineers/Architects | $107,640 | $92,394 | $127,026 | $150,405 | 12,843 |
| Software Quality Assurance Analysts and Testers | $108,680 | $91,374 | $129,792 | $157,899 | 12,770 |
| Computer Programmers | $95,243 | $79,435 | $109,750 | $130,853 | 10,400 |
| Computer and Information Systems Managers | $208,000 | $176,800 | $248,643 | $285,573 | 8,224 |
| Business Intelligence Analysts | $118,893 | $96,500 | $148,000 | $176,824 | 7,949 |
| Computer Systems Analysts | $110,000 | $95,040 | $132,080 | $160,000 | 7,756 |
| Financial and Investment Analysts | $143,220 | $110,000 | $182,978 | $225,000 | 6,754 |
| Mechanical Engineers | $110,000 | $93,292 | $136,500 | $169,224 | 6,448 |
| Accountants and Auditors | $97,406 | $79,500 | $123,120 | $157,000 | 6,036 |
| Electronics Engineers, Except Computer | $156,853 | $128,898 | $181,669 | $216,091 | 5,902 |
| Operations Research Analysts | $115,000 | $89,190 | $151,794 | $193,000 | 5,202 |
| Electrical Engineers | $126,883 | $101,587 | $156,600 | $187,803 | 5,145 |
| Management Analysts | $130,187 | $100,000 | $187,333 | $212,000 | 5,030 |
| Computer and Information Research Scientists | $190,000 | $165,000 | $220,425 | $262,000 | 4,462 |
| Market Research Analysts and Marketing Specialists | $91,270 | $72,800 | $124,848 | $162,000 | 4,411 |
Software Developers dominate the file — 118,662 filings, more than all other occupations in the top ten combined — with a median of $144,936.
But look at the spread rather than the median. The 25th-to-75th range for Software Developers runs from $115,894 to $177,861. That is a $61,967 gap inside the same job title, and it is the single most useful number in this article: it tells you how much room there is between a weak offer and a strong one for exactly the work you do.
Where the money actually is
Two roles are worth calling out because people rarely target them deliberately:
- Computer and Information Systems Managers — median $208,000, the highest of any high-volume occupation here, with 8,224 filings. The step from senior engineer into engineering management is worth more than almost any lateral move.
- Computer and Information Research Scientists — median $190,000 across 4,462 filings, and the 25th percentile ($165,000) sits above the median for most other occupations in the table.
At the other end, Computer Programmers (median $95,243) and QA / Test Analysts sit well below Software Developers for work that often overlaps. If your filing says one of those and your work says the other, that gap is worth raising.
What each city pays
| Worksite city | Median | 25th pct | 75th pct | Filings |
|---|---|---|---|---|
| New York, NY | $158,974 | $116,000 | $200,000 | 24,060 |
| Seattle, WA | $160,600 | $131,600 | $185,000 | 12,009 |
| Austin, TX | $132,891 | $111,238 | $162,500 | 10,113 |
| San Francisco, CA | $187,574 | $150,000 | $220,000 | 8,799 |
| San Jose, CA | $180,000 | $146,000 | $216,091 | 8,400 |
| Sunnyvale, CA | $181,532 | $150,160 | $211,260 | 7,860 |
| Chicago, IL | $119,000 | $90,000 | $153,317 | 6,637 |
| Bellevue, WA | $163,322 | $132,049 | $195,556 | 6,395 |
| Santa Clara, CA | $177,758 | $152,123 | $207,432 | 6,138 |
| Plano, TX | $113,000 | $96,034 | $140,000 | 6,001 |
| Atlanta, GA | $115,000 | $93,974 | $145,105 | 5,759 |
| Dallas, TX | $115,578 | $92,581 | $150,000 | 5,747 |
| Houston, TX | $106,517 | $84,094 | $140,000 | 5,511 |
| Irving, TX | $112,930 | $96,034 | $135,660 | 5,291 |
| Charlotte, NC | $114,706 | $100,000 | $139,000 | 4,966 |
| Mountain View, CA | $196,000 | $167,000 | $224,000 | 4,761 |
| Boston, MA | $126,085 | $95,000 | $161,646 | 4,757 |
| Redmond, WA | $171,200 | $149,240 | $194,740 | 4,727 |
The Bay Area leads on headline pay — San Francisco at $187,574, Sunnyvale at $181,532, Santa Clara at $177,758 — but note Seattle at $160,600 against New York at $158,974, on half the volume.
How to use this in an actual negotiation
- Find your SOC code, not your job title. The filing classifies you under a federal occupation code. "Software Engineer II" is a company title; the SOC is what the wage obligation attaches to.
- Compare to the 75th percentile, not the median. The median includes every staffing-firm filing in the country. If you are at a product company in a major metro, the median is the wrong benchmark.
- Check the city, then the role. Location moves pay more than title does in this data.
- Remember the wage affects more than your bank balance. USCIS runs a weighted selection among H-1B registrations, based generally on the highest OEWS wage level the offered wage equals or exceeds for that occupation and area. A higher offer can improve your position in the lottery itself — see our H-1B cap guide.
- Verify the employer sponsors at all before negotiating anything. Our staffing sponsor guide shows how to check a company in the same file.
What this data cannot tell you
- Total compensation. No equity, no bonus, no sign-on. At the big tech employers this is often the larger half of the package.
- What you personally will be offered. These are distributions, not predictions.
- Seniority. The file has no years-of-experience field, so a new graduate and a principal engineer sit in the same occupation row.
- Whether the job still exists. A certified LCA is a filing, not a hire.
Every figure here is one quarter of filings. The file is republished quarterly and the numbers move. The method is in the sources below if you want to run it yourself.
Questions
What is the median H-1B salary?
Is the LCA wage the same as my total compensation?
Which H-1B occupation pays the most?
Which US city pays H-1B workers best?
Why do Texas cities show lower H-1B salaries?
Does a higher salary improve my H-1B lottery chances?
Where does this salary data come from?
Why is my job title not in the table?
Sources: US Department of Labor — Foreign Labor Certification Performance Data (LCA disclosure files) · US Department of Labor — Labor Condition Application (LCA) programme · USCIS — H-1B Specialty Occupations